- Product
- Infrastructure Monitoring
- Network Performance Monitoring
- Network Device Monitoring
- Container Monitoring
- Serverless
- Cloud Cost Management
- Cloudcraft
- Log Management
- Sensitive Data Scanner
- Audit Trail
- Observability Pipelines
- Application Performance Monitoring
- Universal Service Monitoring
- Continuous Profiler
- Database Monitoring
- Data Streams Monitoring
- Service Catalog
- Dynamic Instrumentation
- Software Composition Analysis
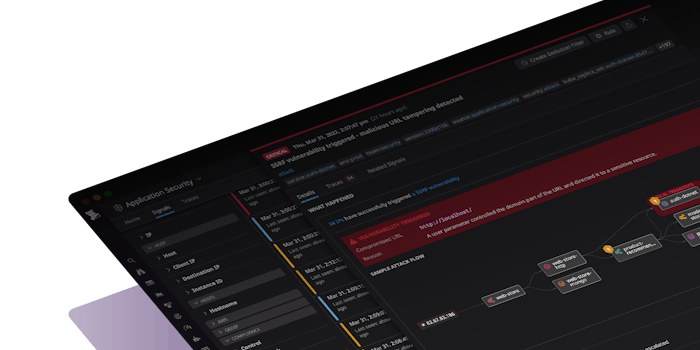
- Application Security Management
- Cloud Security Management
- Cloud SIEM
- Browser Real User Monitoring
- Mobile Real User Monitoring
- Synthetic Monitoring
- Mobile App Testing
- Session Replay
- Error Tracking
- CI Pipeline Visibility
- Test Visibility & Intelligent Test Runner
- Continuous Testing
- Bits AI
- OpenTelemetry
- Workflow Automation
- CoScreen
- Dashboards
- Watchdog
- Alerts
- Incident Management
- Integrations
- IDE Plugins
- API
- Case Management
Infrastructure
Logs
Applications
Security
Digital Experience
Software Delivery
Platform Capabilities
- Customers
- Pricing
- Solutions
- Financial Services
- Manufacturing & Logistics
- Healthcare/Life Sciences
- Retail/E-Commerce
- Government
- Education
- Media & Entertainment
- Technology
- Gaming
- Amazon Web Services Monitoring
- Azure Monitoring
- Google Cloud Platform Monitoring
- Kubernetes Monitoring
- Red Hat OpenShift
- Pivotal Platform
- OpenAI
- SAP Monitoring
- OpenTelemetry
- Cloud Migration
- Monitoring Consolidation
- Unified Commerce Monitoring
- DevOps
- Shift-Left Testing
- Digital Experience Monitoring
- Security Analytics
- Compliance for CIS Benchmarks
- Hybrid Cloud Monitoring
- IoT Monitoring
- Machine Learning
- Real-Time BI
- On-Premises Monitoring
- Log Analysis & Correlation
Industry
Technology
Use-case
- About
- Blog
- Docs
- Login
- Get Started Free